
B-hHER2 mice
C57BL/6-Erbb2tm1(ERBB2)Bcgen/Bcgen • 110812
B-hHER2 mice
C57BL/6-Erbb2tm1(ERBB2)Bcgen/Bcgen • 110812
在此页面上
- Targeting strategy
- Phenotypic analysis
- Toxicity
- Physiological data
发表文章
- January 15, 2021Science Advances
- May 20, 2019Nature Communications
 Targeting strategy
Gene targeting strategy for B-hHER2 mice. The exons 2-17 of mouse Erbb2 gene that encode the extracellular and transmembrane domains were replaced by human ERBB2 exons 2-17 in B-hHER2 mice.
 mRNA expression analysis
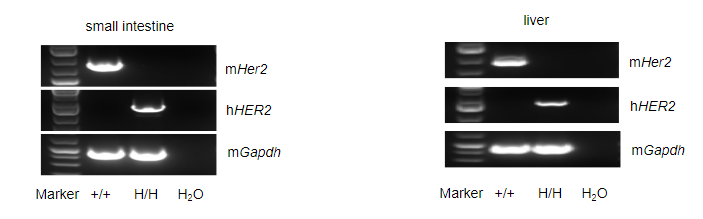
Strain specific analysis of HER2 gene expression in wild type (WT) mice and B-hHER2 mice by RT-PCR. Mouse Her2 mRNA was detectable only in small intestine and liver of WT mice (+/+). Human HER2 mRNA was detectable only in homozygous B-hHER2 mice (H/H) but not in WT mice (+/+).
IHC analysis of HER2 expression
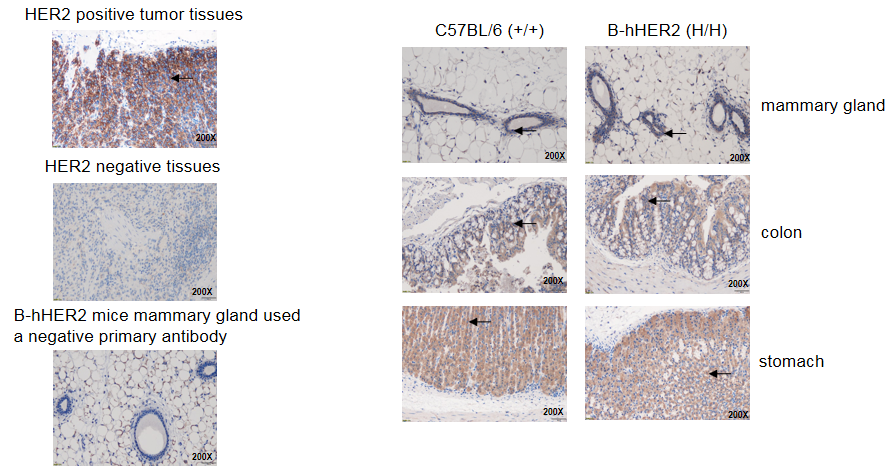
Immunohistochemical (IHC) analysis of HER2 expression in homozygous B-hHER2 mice. The mammary gland, colon and stomach tissues were collected from WT and homozygous B-hHER2 mice (H/H) and analyzed by IHC with anti-Her2 antibody. HER2 was detectable in WT mice and homozygous B-hHER2 mice due to the cross-reactivity of the antibody. The arrow indicates tissue cells with positive HER2 staining (brown).
mRNA expression profile of HER2
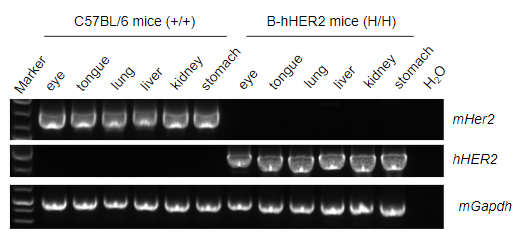
Strain specific analysis of HER2 gene expression in wild type (WT) mice and B-hHER2 mice by RT-PCR. Mouse Her2 mRNA was detectable only in eye, tongue, lung, liver, kidney and stomach of WT mice (+/+). Human HER2 mRNA was detectable only in homozygous B-hHER2 mice (H/H) but not in WT mice (+/+).
Analysis of spleen leukocytes cell subpopulations in B-hHER2 mice
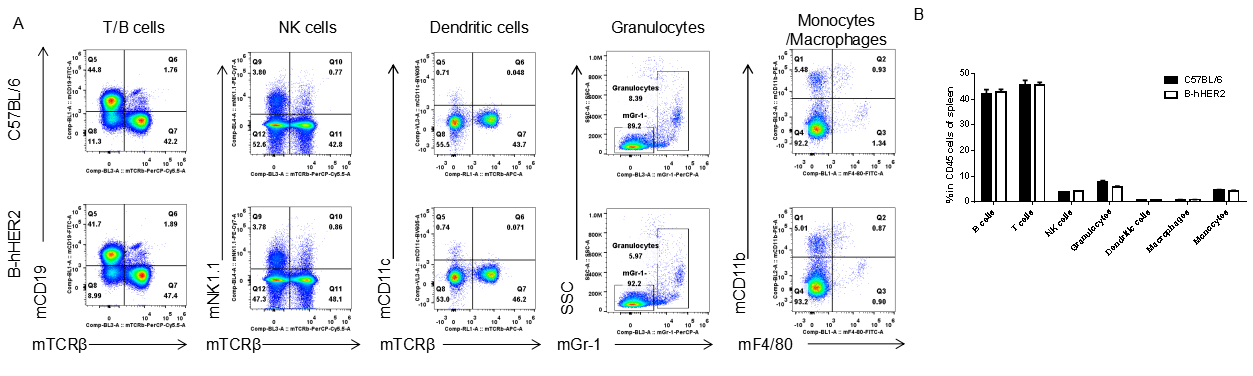
Analysis of spleen leukocyte subpopulations by FACS. Splenocytes were isolated from female C57BL/6 and B-hHER2 mice (n=3, 9 week-old). Flow cytometry analysis of the splenocytes was performed to assess leukocyte subpopulations. A. Representative FACS plots. Single live cells were gated for CD45 population and used for further analysis as indicated here. B. Results of FACS analysis. Percent of T cells, B cells, NK cells, dendritic cells, granulocytes, monocytes and macrophages in homozygous B-hHER2 mice were similar to those in the C57BL/6 mice, demonstrating that introduction of hHER2 in place of its mouse counterpart does not change the overall development, differentiation or distribution of these cell types in spleen. Values are expressed as mean ± SEM.
Analysis of spleen T cell subpopulations in B-hHER2 mice
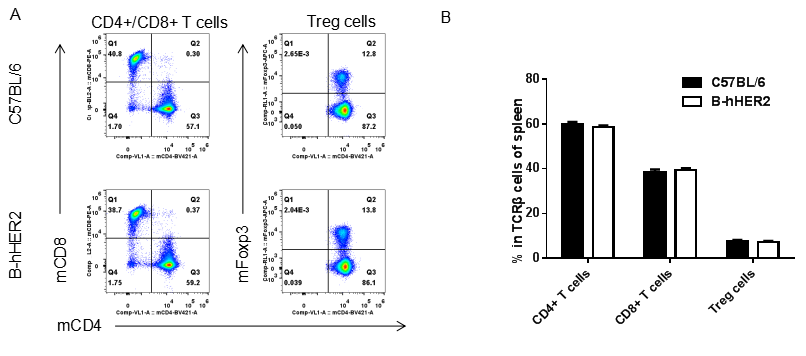
Analysis of spleen T cell subpopulations by FACS. Splenocytes were isolated from female C57BL/6 and B-hHER2 mice (n=3, 9 week-old). Flow cytometry analysis of the splenocytes was performed to assess leukocyte subpopulations. A. Representative FACS plots. Single live CD45+ cells were gated for CD3 T cell population and used for further analysis as indicated here. B. Results of FACS analysis. Percent of CD8+ T cells, CD4+ T cells and Tregs in homozygous B-hHER2 mice were similar to those in the C57BL/6 mice, demonstrating that introduction of hHER2 in place of its mouse counterpart does not change the overall development, differentiation or distribution of these T cell sub types in spleen. Values are expressed as mean ± SEM.
Analysis of lymph node leukocytes cell subpopulations in B-hHER2 mice
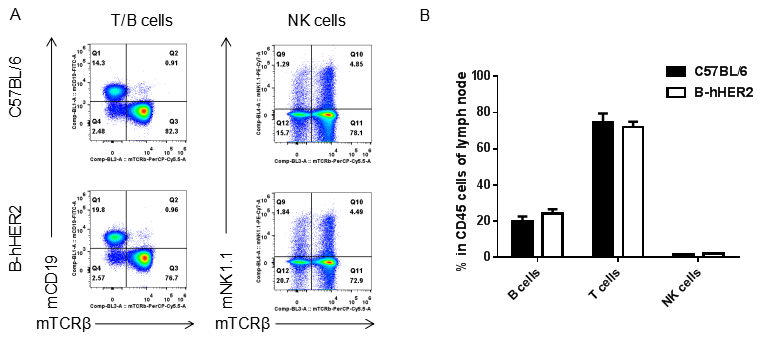
Analysis of lymph node leukocyte subpopulations by FACS. Leukocytes were isolated from female C57BL/6 and B-hHER2 mice (n=3, 9 week-old). Flow cytometry analysis of the leukocytes was performed to assess leukocyte subpopulations. A. Representative FACS plots. Single live cells were gated for CD45 population and used for further analysis as indicated here. B. Results of FACS analysis. Percent of T cells, B cells and NK cells in homozygous B-hHER2 mice were similar to those in the C57BL/6 mice, demonstrating that introduction of hHER2 in place of its mouse counterpart does not change the overall development, differentiation or distribution of these cell types in lymph node. Values are expressed as mean ± SEM.
Analysis of lymph node T cell subpopulations in B-hHER2 mice
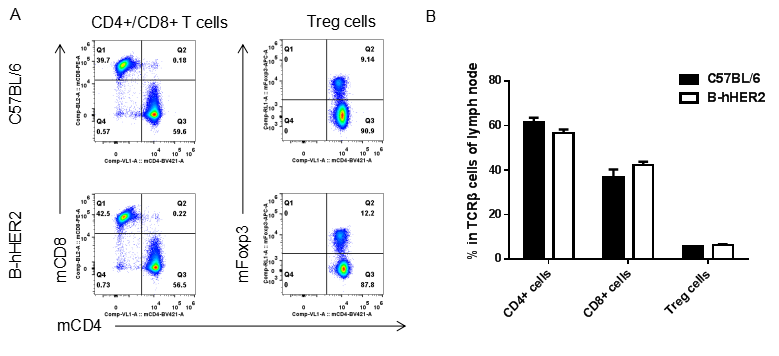
Analysis of lymph node T cell subpopulations by FACS. Leukocytes were isolated from female C57BL/6 and B-hHER2 mice (n=3, 9 week-old). Flow cytometry analysis of the leukocytes was performed to assess leukocyte subpopulations. A. Representative FACS plots. Single live CD45+ cells were gated for CD3 T cell population and used for further analysis as indicated here. B. Results of FACS analysis. Percent of CD8+ T cells, CD4+ T cells and Tregs in homozygous B-hHER2 mice were similar to those in the C57BL/6 mice, demonstrating that introduction of hHER2 in place of its mouse counterpart does not change the overall development, differentiation or distribution of these T cell sub types in lymph node. Values are expressed as mean ± SEM.
Analysis of blood leukocytes cell subpopulations in B-hHER2 mice
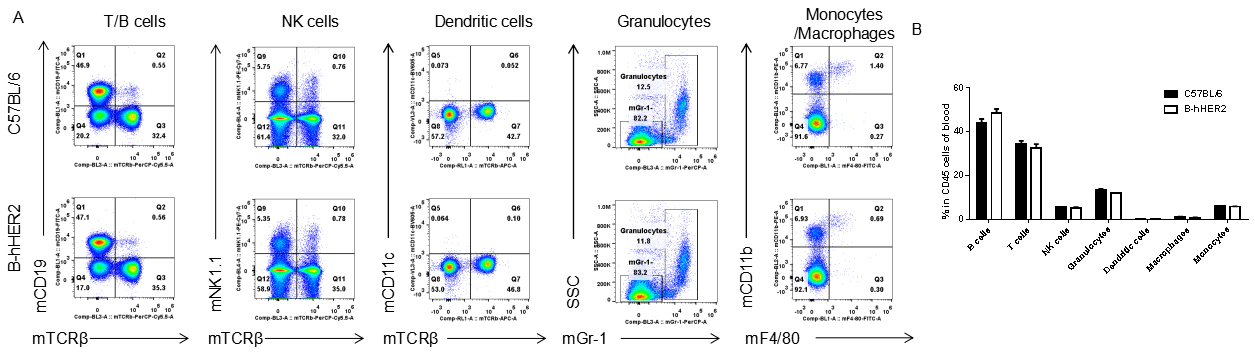
Analysis of blood leukocyte subpopulations by FACS. Blood cells were isolated from female C57BL/6 and B-hHER2 mice (n=3, 9 week-old). Flow cytometry analysis of the blood leukocytes was performed to assess leukocyte subpopulations. A. Representative FACS plots. Single live cells were gated for CD45 population and used for further analysis as indicated here. B. Results of FACS analysis. Percent of T cells, B cells, NK cells, dendritic cells, granulocytes, monocytes and macrophages in homozygous B-hHER2 mice were similar to those in the C57BL/6 mice, demonstrating that introduction of hHER2 in place of its mouse counterpart does not change the overall development, differentiation or distribution of these cell types in blood. Values are expressed as mean ± SEM.
Analysis of blood T cell subpopulations in B-hHER2 mice
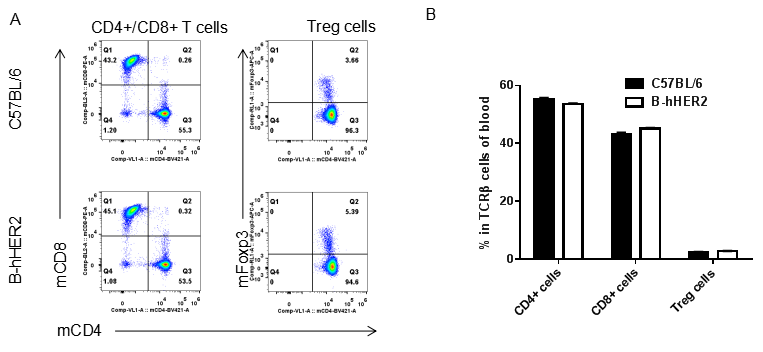
Analysis of blood T cell subpopulations by FACS. Blood cells were isolated from female C57BL/6 and B-hHER2 mice (n=3, 9 week-old). Flow cytometry analysis of the leukocytes was performed to assess leukocyte subpopulations. A. Representative FACS plots. Single live CD45+ cells were gated for CD3 T cell population and used for further analysis as indicated here. B. Results of FACS analysis. Percent of CD8+ T cells, CD4+ T cells and Tregs in homozygous B-hHER2 mice were similar to those in the C57BL/6 mice, demonstrating that introduction of hHER2 in place of its mouse counterpart does not change the overall development, differentiation or distribution of these T cell sub types in blood. Values are expressed as mean ± SEM.
 Toxicity test in B-hHER2 mice-Case 1
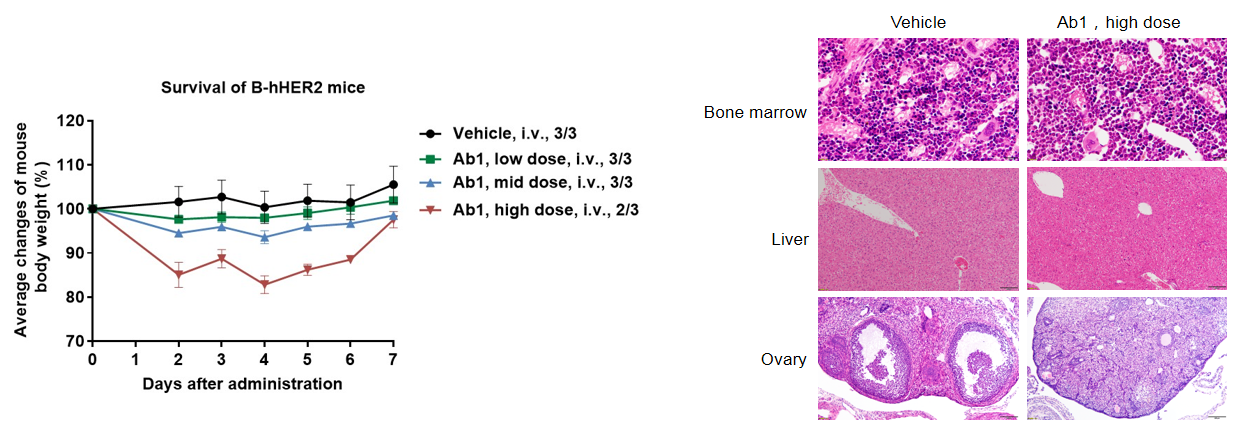
Different doses of anti-human HER2 antibody Ab1 were injected into B-hHER2 mice via a single intravenous injection. The body weight of B-hHER2 mice decreased in a dose-dependent manner. In the high-dose group, one mouse died. Histopathological analysis revealed no significant abnormal changes in liver, but no immature follicles were seen in ovaries, and the myeloid cells in the bone marrow increased and the red blood cell count decreased. This suggests that B-hHER2 mice can be used to assess the toxicity of anti-human HER2 antibodies. Data is obtained from a partner. Values are expressed as mean ± SEM.
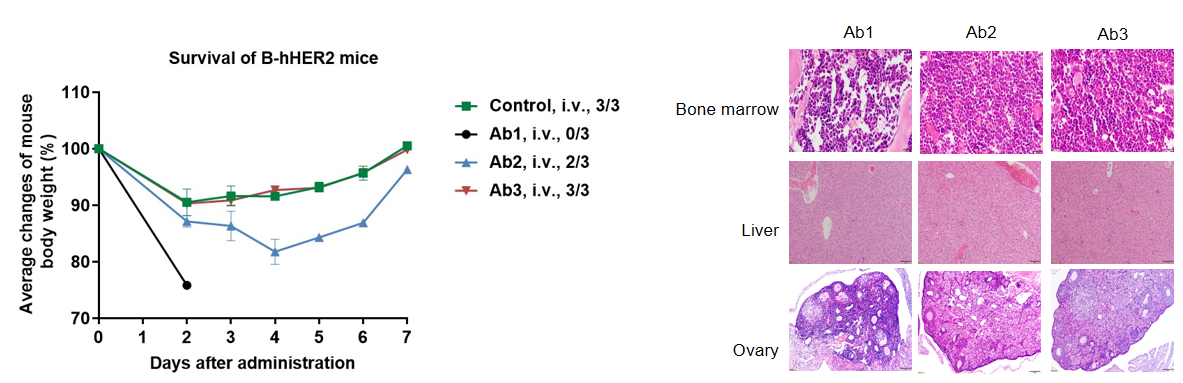
Toxicity test in B-hHER2 mice-Case 2
 Blood routine test in B-hHER2 mice
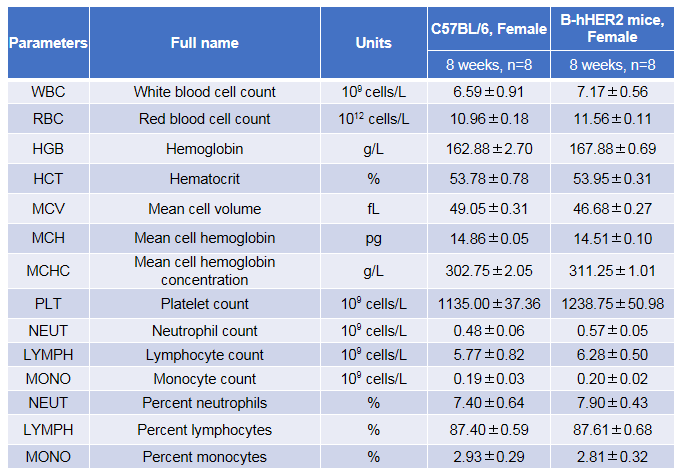
Complete blood count (CBC). Blood from female C57BL/6 and B-hHER2 mice (n=8, 8-week-old) was collected and analyzed for CBC. There was no differences among any measurement between C57BL/6 and B-hHER2 mice, indicating that introduction of hHER2 in place of its mouse counterpart does not change blood cell composition and morphology. Values are expressed as mean ± SEM.
Blood biochemistry of B-hHER2 mice
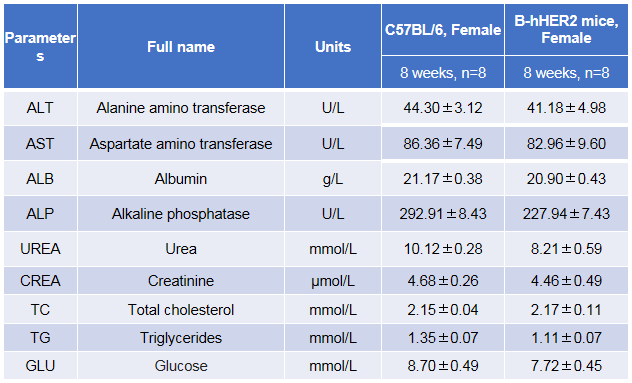
Blood biochemistry tests of B-hHER2 mice. Serum from the C57BL/6 and B-hHER2 mice (n=8, 8-week-old) was collected and analyzed for levels of ALT and AST. There was no differences on either measurement between C57BL/6 and B-hHER2 mice, indicating that introduction of hHER2 in place of its mouse counterpart does not change ALT and AST levels or health of liver. Values are expressed as mean ± SEM.